

Selim Koç solves the global speed problem—optimizing WordPress, WooCommerce, and enterprise platforms to perform seamlessly at scale across worldwide markets. With 20+ years of experience from Istanbul to Silicon Valley and Tokyo, he builds cloud-native, distributed systems for high-traffic ecommerce and media websites.
Speed at Home ≠ Speed Around the Globe
Here’s the thing: fast in your office doesn’t mean fast everywhere your customers actually are. On the hotel’s ground floor, thick walls meant slower mobile coverage, a perfect reality check that the environment still matters.
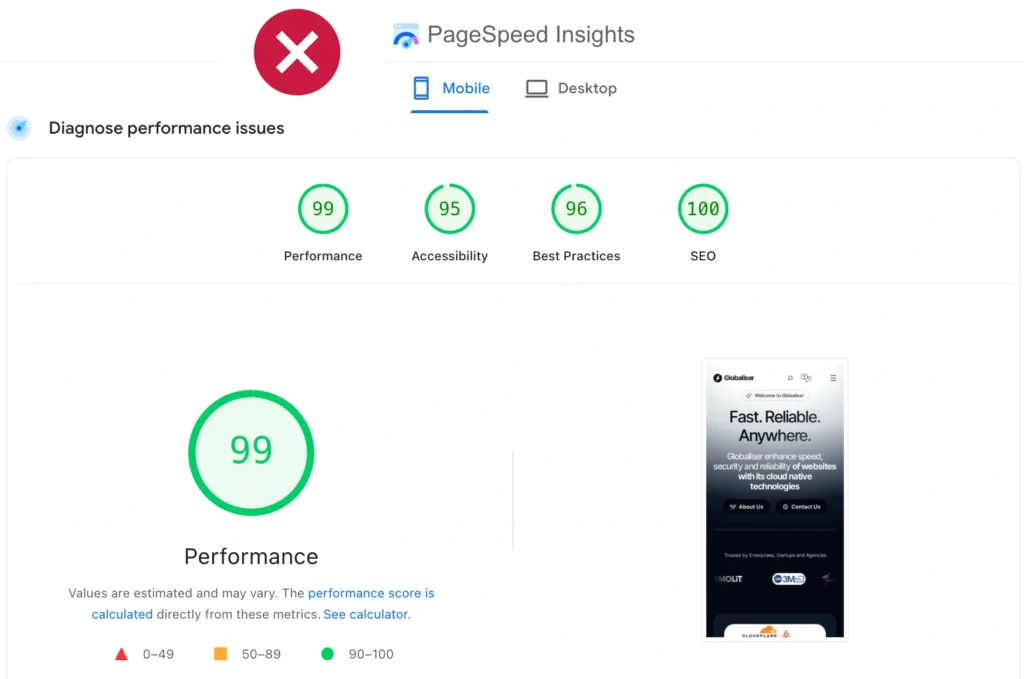
The sceptical questions came next: “Alright, it’s fast here in Turkey, but what about Germany? The UK? The US?” Exactly the right question, because it reveals what most people fundamentally misunderstand about international SEO and website speed. Your website might test brilliantly on your office desktop, scoring 95/100 on Google PageSpeed Insights or getting an A grade on GTmetrix. But that’s not where your international customers experience it. They’re on patchy 4G, in different countries, with completely different infrastructure. And if you’re only testing locally, you have absolutely no idea what they’re experiencing.
The problem gets worse when you consider that:
- Most traffic is now mobile — Over 60% of web traffic globally comes from mobile devices
- Mobile connections vary wildly — That £1,200 iPhone in your pocket often connects via slow 4G (or a fast 3G) that makes your site load like it’s 1999
- Geography matters enormously — A site optimised for UK users might be painfully slow in Singapore, or vice versa
When we talk about test scores in this article, we mean those 0-100 scores for Mobile and Desktop from Google’s PageSpeed testing tool, the A-F grades from GTmetrix, or similar scores from any other speed testing tools. These numbers can be misleading if you don’t understand what they actually measure.
Once again, don’t optimise for those scores above! This is actually why many businesses have become sceptical about speed optimisation. They invested time and money improving their test scores, saw those numbers turn green, but experienced no improvement in rankings, conversions, or revenue. The problem wasn’t that speed doesn’t matter, it was that they were optimising the wrong thing. Aim for lowest LCP values with minimal CLS instead of higher scores on this lab test.
Testing from Home ≠ Testing from the Globe
Let me ask you something: when was the last time you actually tested your website’s speed properly? And by “properly,” I don’t mean running PageSpeed Insights from your office, seeing a green score of 85, and calling it a day. I mean genuinely understanding what your actual customers experience when they try to visit your site from San Francisco, New York, or Tokyo, on their phones, on real mobile connections. Most people haven’t. And that’s a problem.
Here’s the disconnect: testing scores don’t reflect how your users actually experience your site. You can have a perfect 95 PageSpeed score, but if a customer in San Francisco is staring at a blank screen for four seconds on their iPhone, that score is worthless. And here’s what marketers need to understand: this isn’t something you can completely outsource to your tech team. Yes, they handle the implementation, but as a marketer, you need to know what actual users think about your site. Because if your international SEO campaigns are driving traffic that bounces immediately due to slow loading, all your keyword research and content strategy means nothing.
Speed Testing Like It’s 2009
Here’s what makes this worse: for over 15 years, GTmetrix’s default test was desktop speed from Canada. Recently, they changed it to Seattle, USA, on a desktop with a high-speed connection.
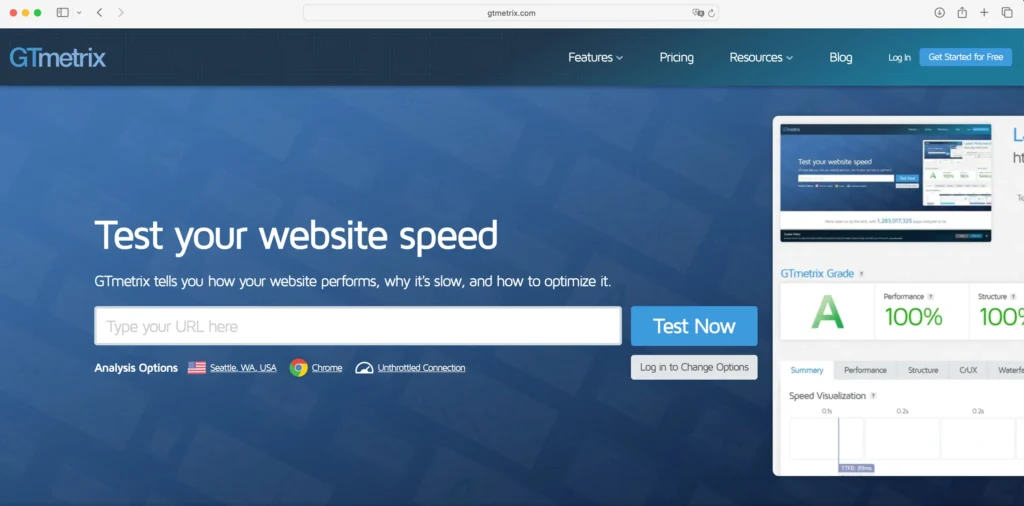
Unless your target audience is specifically “people using desktop computers in Seattle,” those results are essentially meaningless. It’s like testing a car on a German autobahn and being surprised when it struggles in London traffic. PageSpeed Insights is better. It tests from multiple locations, but you can’t choose where. If your market is the US but Google tests from the EU, you’re still not seeing what your users see. If you create an account you can have more options to select for your speed testing.
The Location Reality
Your website isn’t stored in some magical cloud that’s equally close to everyone. It’s on servers in physical locations. If your server is in London and your customer is in San Francisco, that data has to travel across the Atlantic. Physics applies, and physics doesn’t care about your PageSpeed score. This is why testing from multiple locations matters enormously. A site might load in 1.2 seconds from London but take 4.5 seconds from San Francisco. Same site, same setup, completely different user experience. And here’s the kicker: over 60% of web traffic globally now comes from mobile devices, often on connections that make your office WiFi look like magic.
Alright, You Talk Big. Show Me Your Numbers…
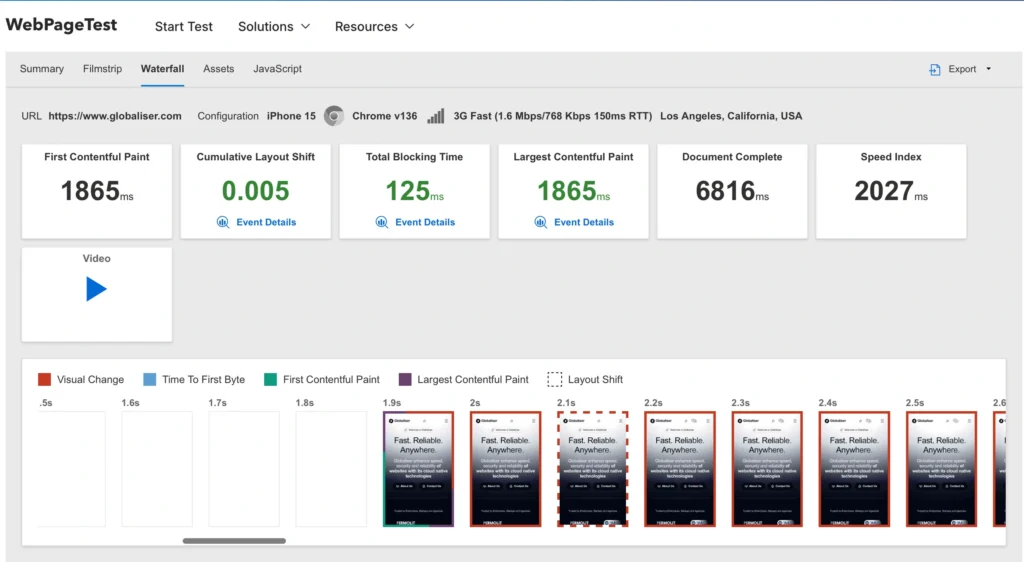
Fair challenge. Here’s how Globaliser.com actually performs when tested from the USA, Europe, and Asia:
Test from California, USA , LCP : 1.86s
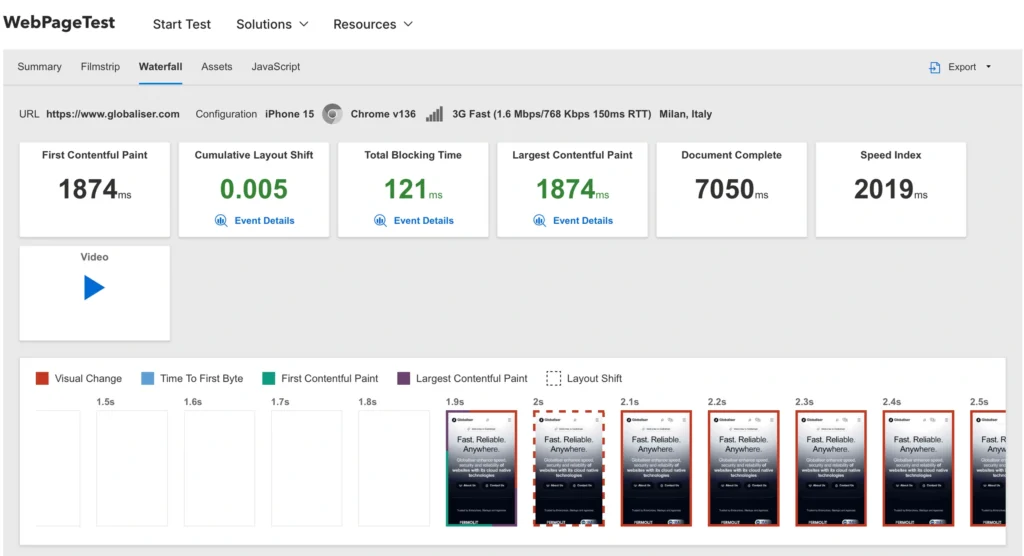
Test from Italy, EU, LCP : 1.87s
Test from Singapore, LCP : 1.85s
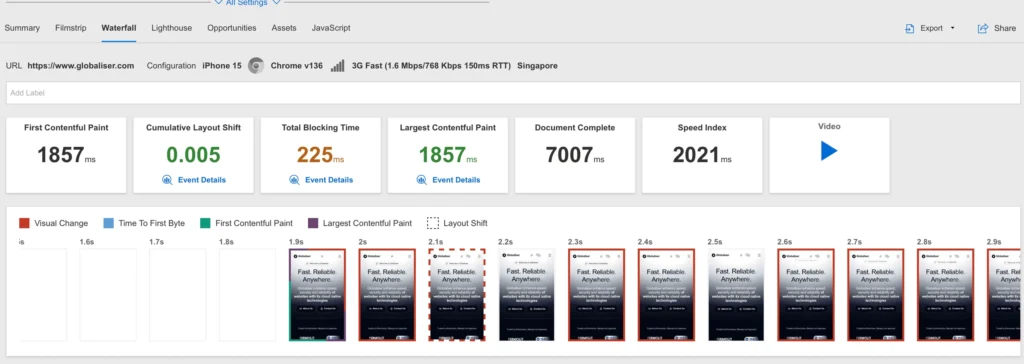
Tests run on mobile with Fast 3G connection via WebPageTest.org
Same site, consistently fast globally. That’s what optimising for the King actually looks like.
What Slow International Speed Actually Costs You
Speed isn’t just a technical metric. It’s a business metric that affects three critical areas:
Your Rankings Are Suffering
Google doesn’t just measure your site’s speed from one location anymore. Core Web Vitals data comes from real Chrome users worldwide. If your site is fast in London but slow in San Francisco, Google knows. And your US rankings suffer accordingly. Think you’re doing international SEO? You’re not. You’re doing local/national SEO on multiple locations.
Your Ad Spend Is Being Wasted
Your Google Ads Quality Score depends partly on landing page speed. If your perfectly crafted ad campaign is sending US traffic to a landing page that takes 5 seconds to load from New York, you’re paying more per click AND converting less.
Your Conversions Are Tanking
At the Search’n Stuff event, Arnout Hellemans showed something revealing: a 0.5-second speed improvement generated nearly £20 million in additional revenue. When your website is making money, whether through e-commerce or leads, the output and revenue get higher for every millisecond of speed increase.
This isn’t theoretical. It’s measured, real-world business impact. Amazon discovered this in 2006, every 0.1s speed increase results %1 conversion rate increase. If you think a middle sized business may not get similar outcomes? This was Amazon who is already a well known brand in e-commerce. There are many similar findings from Walmart, Akamai, and more.
What Actually Matters: The Metrics Users Feel
Here’s something that sounds obvious but is routinely ignored: your customers don’t care about your PageSpeed score. They care about whether your website shows up fast when they’re actually using it. Shortly, is it usable or not.
This is perceived speed versus tested speed, and understanding the difference is worth its weight in conversions.
LCP: What Users Actually See
You can have technically fast metrics, low Time to First Byte (TTFB), decent First Contentful Paint (FCP), but if your users see a blank screen for three seconds because your hero image is loading slowly, the technical numbers are irrelevant. This is where Largest Contentful Paint (LCP) matters. LCP measures when the largest element in the viewport, what users actually see on their screen, finishes loading. Not the entire page, just the viewable area.
First Contentful Paint shows when any content appears, but LCP tells you when the meaningful stuff, your hero image, main headline, the content people came for, is actually visible. For international SEO, this is critical. A site hosted in London might have great TTFB locally but terrible LCP in San Francisco because that hero image takes forever to cross the Atlantic.
CLS: When Your Page Layout Won’t Stay Still
You’ve experienced this: you’re about to click a button, and suddenly everything shifts down because a CSS file loaded late, and you end up clicking an advert instead. Infuriating, isn’t it?
That’s Cumulative Layout Shift (CLS), and it’s the digital equivalent of trying to hit a moving target. Google knows users hate it, which is why it’s part of Core Web Vitals. More importantly, your international users hate it even more when it happens on slow connections.
The Limitations of Score-Only Optimisation
Let’s address something important: CLS became a Core Web Vital because the industry learned a hard lesson. Some optimisation approaches achieved impressive test scores whilst actually making the user experience worse. The numbers looked great, but the experience didn’t. Watch out for optimisation strategies that:
- Achieve high scores but break site functionality or design
- Only the header is visible, and the page doesn’t actually load until you move your cursor
- Content jumps around whilst loading, but hey, the PageSpeed score looks great!
These approaches reveal a fundamental misunderstanding: test scores measure technical performance, but they don’t guarantee good user experience. You can have a 95 PageSpeed score and still frustrate every visitor.
Google added CLS to Core Web Vitals to address this disconnect, ensuring that optimisation considers both speed and stability. The lesson is clear: optimise for your users’ actual experience, and let the test scores follow naturally.
Mobile Speed: Where Your Traffic Actually Is
Most speed tests run on what’s called a “3G Fast” or “Slow 4G” connection, 1.6 Mbps download, 150ms latency. That’s Google’s standard for mobile testing, and it’s a reasonable baseline for average mobile experience globally. But here’s the thing: many people test on their office WiFi or home broadband. You get brilliant scores, everything looks fantastic, and then you check your analytics and see that mobile bounce rates are through the roof.
Why? Because your actual users aren’t on your office WiFi. They’re on the bus, in a café, walking down the street. Testing on proper mobile connections shows you the truth. It’s not always comfortable, but it’s real.
The Reality Check: Test Like Your Revenue Depends On It
So how should you actually test your website for international SEO? Here’s what actually works:
The Basic Reality Check
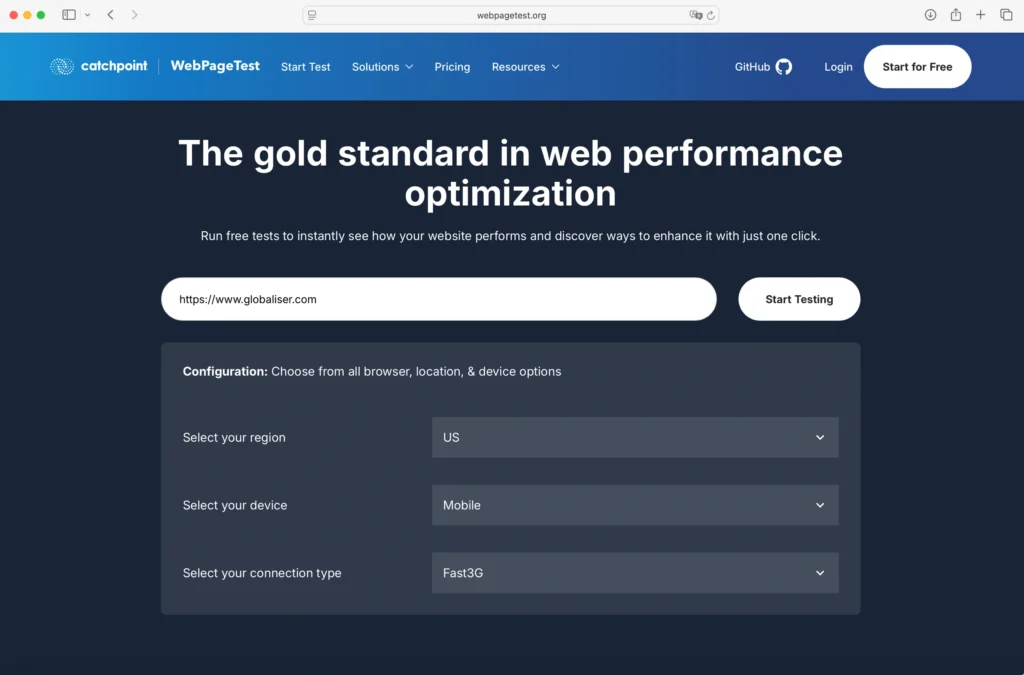
Open https://www.webpagetest.org and run this simple test:
- Enter your website URL
- Select a region: Europe or US (wherever your target market is)
- Select device: Mobile
- Select connection: Fast 3G
Now watch when your page content actually appears. Is it below 2 seconds? Around 3 seconds? Or does it take ages?
If you’re seeing 3+ seconds in your target regions, you’ve got a problem. And if you’re seeing that in Europe but targeting the US? You’re likely not actually reaching your US audience effectively. This is just the starting point. Once you understand your site’s basic situation, you need to dive deeper with more location testing. If you create an account you can have more options to select for your testing.
But Appearing Fast Isn’t Enough
Here’s what most people miss: content appearing is one thing, but is your site actually usable at that moment?
If a user clicks on something, does it respond immediately? Or does it still need some time to become functional? This is the second critical metric, and it’s harder to measure because standard tests don’t capture it well. You might need an expert to properly test this.
The King Wants What The King Wants
Think of your user as royalty, because in terms of your revenue, they are. Your King wants the site to appear fast AND respond to their commands immediately. They don’t care about your excuses, your tech stack, or your PageSpeed score.
This is what we call perceived speed. Whether the King thinks your site is fast or slow depends on two basic instincts:
- Does the viewable area appear fast?
- Is it ready to use immediately when they try to interact with it?
And critically: there should be no layout shakes (CLS) whilst this is happening. Nothing frustrates users more than content jumping around when they’re trying to click something.
The Secret to International SEO Success
Here’s the truth: please the local Kings globally (I mean the Kings in your target areas, this can be multiple US states, countries, or cities), get the reward. It’s that simple.
Sky-rocketing your international SEO rankings or conversions isn’t about gaming algorithms or chasing test scores. It’s about optimising for your King, the actual user experiencing your site from San Francisco, London, Istanbul, or Tokyo. For speed optimisation, you need to optimise for your King, not for testing scores.
Test Website Speed Where Your Customers Actually Are
For the US market, you need to test at least three locations: New York, Texas, and San Francisco. The US is massive, and network infrastructure varies significantly coast to coast. But here’s the crucial bit: this depends entirely on your company’s marketing plans.
- Targeting specific US states? Test from those states.
- Running campaigns in multiple countries? Tests from those countries.
- Targeting Dubai? Making tests at your office in London or from a test server in Canada is not a reality check. It’s fantasy.
Look at your Google Analytics. Where is your actual traffic coming from? Those are the locations you need to test from.
What to Look For
Don’t just check the overall score. Watch for:
- Largest Contentful Paint (LCP): When does the main content actually appear? Under 2.5 seconds is good, over 4 seconds is terrible.
- Interaction readiness: Can users actually click and interact immediately, or is the page still loading scripts?
- Visual stability: Does the page look broken whilst loading? That’s CLS ruining the King’s experience.
- Blank screen time: How long do users stare at nothing? Every second costs you conversions.
The Real User Reality Check by Google
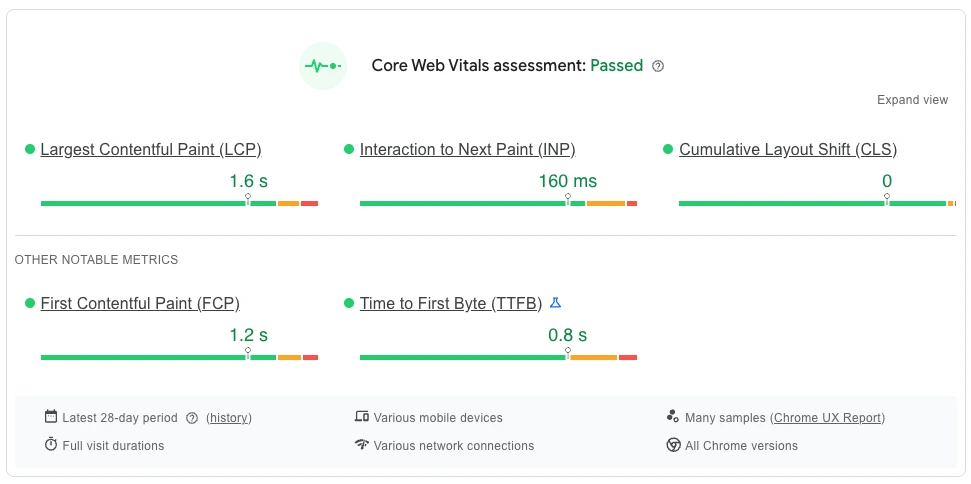
After your synthetic tests, check Google PageSpeed Insights for CrUX data (Chrome User Experience Report). This shows what real users experienced over the past 28 days.
If your lab tests look brilliant but CrUX data is terrible, you have a real-world performance problem that synthetic tests aren’t catching. And if CrUX shows slow performance in specific countries, you know exactly where your international SEO is failing.
Reading Your 28-Day Real User Summary
Google collects performance data from actual Chrome users visiting your site. If you have sufficient traffic (typically 50+ daily visitors), you’ll see this real-world data summarised at the top of your PageSpeed test results.
Here’s how to access the full picture:
- Click “Origin” tab: This shows your entire site’s performance, not just the single URL tested
- Click “Expand view”: This reveals detailed Core Web Vitals breakdowns
Pay close attention to the assessment ratings. “Failed” ratings indicate real users are experiencing poor performance, not theoretical lab problems, but actual visitor frustration. This data directly impacts your SEO rankings.
Screenshot of Amazon.co.uk PageSpeed summary showing the overview.
Historical Performance Analysis (10 Months)
The 28-day summary is useful, but for strategic insights, dive deeper into Google’s historical data. PageSpeed Insights provides up to 10 months of monthly performance comparisons, showing:
- Month-by-month Core Web Vitals trends
- Whether your site is improving or degrading over time
- Google’s assessment of your performance trajectory
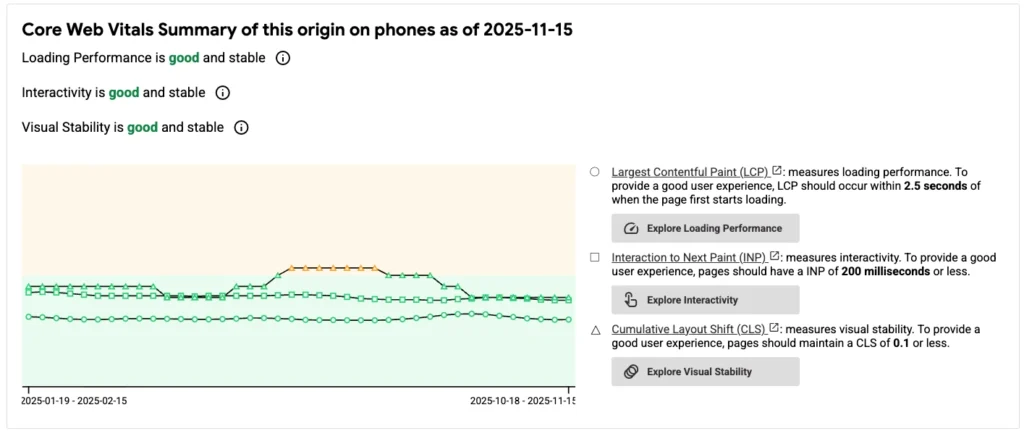
Screenshot showing the detailed 10-month view
Why International SEO Isn’t Just Hreflang Tags
Let’s be clear: you added hreflang tags, so what? Does Google automatically show you all over the world now?
You know you need local links and authority in target countries. You’ve optimised your content, set up hreflang correctly, and you’ve got a decent PageSpeed lab score. But if you’re doing everything right and not seeing results, you have very high potential to skyrocket your organic traffic and conversion rate by adding the speed factor to the mix.
Real Results from Real Companies
ATP Autoteile’s SEO lead shared a painful lesson at the Search’n Stuff event: they wasted over a million dollars on a Vue Storefront framework that looked good in tests but failed in real-world performance. The lesson? Being called “Modern E-commerce Frontend” don’t equal real performance.
Ok. Let me add a small relevant advertorial of a free open source JavaScript library here. If you want real performance for your web app, try Tay, a lightweight TypeScript library, just 1KB in size. It can make your e-commerce site or any web app incredibly fast, as long as you’re comfortable with TypeScript and not a fan boy of SPAs.
Reality Beats Theory Every Time
The connection speed in Antalya? It was the perfect reality check. Globaliser worked because we’d tested for reality, multiple locations, mobile devices, slow connections. We’d optimised for the King’s experience, not test scores. If you’re testing from your office and wondering why international SEO isn’t working, now you know: you’ve been optimising for the wrong thing. It wasn’t magic. It was because we’d tested and optimised for exactly that scenario. We knew that:
- Mobile connections are often quite slow and inconsistent
- Users are impatient (three seconds is forever in internet time)
- What matters is perceived speed, how quickly something meaningful appears and useful
Website speed isn’t about impressing other developers with your test scores. It’s about whether real humans, in real locations, on real devices, can actually use your website without wanting to throw their phone across the room. The solution isn’t complicated, but it does require changing how you think about testing:
- Test from multiple locations where your users actually are
- Test on mobile devices with realistic mobile connection speeds
- Watch the visual loading experience, not just the metrics
- Monitor real user performance, not just lab tests
- Understand that a high PageSpeed score means nothing if real users have a slow experience
Think Like Google Or ChatGPT
Think about it from the opposite perspective: You’re Google or OpenAI, and you need to decide who to show or recommend to a user in San Francisco or London. There are too many companies to suggest. Let’s assume content quality and link profiles are roughly equal. Which companies would you prefer to suggest to your users? The ones who invested in the presentation layer of their content for those countries? Or the ones who think speed doesn’t matter?
I’m not saying speed is the most important thing, or that you’ll get the best results with speed alone. Rather, speed perfects your hard work. It can be your secret weapon to win over competitors who don’t care about it.
Do This Right Now
Want to see how your site actually performs for real users? Stop guessing. Test from multiple locations on mobile devices with realistic connection speeds. Your business will thank you. Watch what your Kings actually see. If it’s slow, you’ve found your problem. Fix the King’s experience, and your rankings and conversions will follow.
The only speed that matters is the speed your customers experience. Test for that, or keep wondering why your international SEO isn’t working.
FAQs
Yes. Google measures Core Web Vitals from real users in each region. If your site is fast in the UK but slow in the US, your US rankings will suffer whilst UK rankings remain the same.
LCP (Largest Contentful Paint) matters far more. It measures when the main content actually appears on screen, what users see and experience. A site can have a poor PageSpeed score but excellent LCP, or vice versa. Google’s Core Web Vitals focus on LCP because it reflects real user experience.
WebPageTest, Gtmetrix, SpeedVitals . All have a free membership option that gives you more testing credits and settings.
CDN can help if your site has high traffic so its cache warm up, and a traditional CDN will not store your site’s main cache (html documents), so even warmed CDN will store only static elements like images and scripts but pull the main html from the main origin server.
You need hreflang tags, local backlinks, optimised content, AND fast loading in each target region. Your site’s performance on target markets will directly affect your SEO performance on that target location.
Aim for LCP under 2.5 seconds on mobile with Fast 3G connection in all your target markets.
3 days. Yes we saw our clients traffic changed just after 3 days they released a fixed version of the site. Your Google monthly report will need 28 days, as they keep 28 day retention on their general summary.
Mobile, absolutely. Over 60% of global traffic is mobile, and Google uses mobile-first indexing. Mobile users also typically have slower, less reliable connections, making speed even more critical. If you can only choose one, always prioritise mobile.
WordPress is excellent for international SEO, but standard hosting and CDN combinations don’t solve the fundamental problem: your site is still served from one origin location, making it slow for international visitors.